Async-friendly performance counter

This article was originally published on the DFINITY Medium blog here by Andriy Berestovskyy.
Background
The Internet Computer can host a full dapp — frontend, backend and data. Users can deploy their dapp as a canister (smart contract) on the Internet Computer. Each canister can store up to 500GiB of data and execute up to 40 Billion WebAssembly instructions per transaction.
Unlike other blockchains, the Internet Computer offers developers enormous amounts of resources. This poses a real challenge for canister developers: writing efficient canister code. The more efficient a canister is, the less cycles it pays.
Performance counter is the way for a canister (smart contract) to track the amount of work done. This information could be used as the main metric to optimize the code.
The Internet Computer provides this System API call:
ic0.performance_counter : (counter_type : i32) -> i64
The type argument specifies which performance counter to return. For a long time only type 0 counter was supported on the Internet Computer — the number of WebAssembly instructions the canister has executed since the beginning of the current message execution.
This type 0 counter works well, and many developers use it daily. But the counter is valid only for the current message, and it resets after each await point.
How could it be improved?
We are introducing a new call context performance counter (type 1) to track the executed WebAssembly instructions across await points.
Comparing the performance counters
Consider this example function:
#[query(composite = true)]
async fn example() -> (u64, u64) {
    do_some_work();
❶   call(id(), "nested_call", ())
❷       .await;
    do_some_work();
❶   call(id(), "nested_call", ())
❷       .await;
    do_some_work();
❸   (performance_counter(0), performance_counter(1))
}
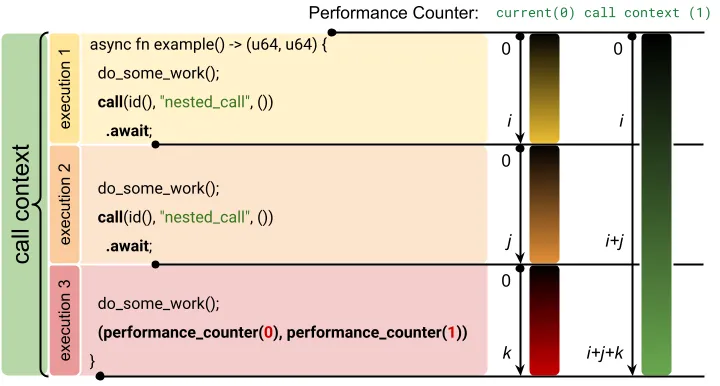
The function ❶ makes two nested calls, ❷ awaits them, and finally ❸ replies to the original call.
From the developer’s point of view, it’s just one function. From the user’s perspective, it’s just one call. But in fact, under the hood, there are three message executions:
The original call is executed up until the first await point.
Then the reply to that call triggers the second execution.
At the end, yet another reply triggers the final part, which replies to the original call with two performance counters.
There is a call context to track the original call. The Internet Computer creates it for each call and keeps it around until the call is either replied or rejected.
The performance counter type 0 just follows those three message executions. It starts from 0 and goes up to some value i. After the first await, it resets and goes up to j, and then up to k.
On the other hand, the new type 1 counter lives in the call context, so it monotonically increases until the original call is replied. In this example, it starts from 0 and goes to i, i+j and then up to i+j+k.
The results are similar. Can just the old type 0 counter do the job?
To get the same i+j+k result with the counter type 0, the counter should be saved before each reset:
#[query(composite = true)]
async fn example() -> u64 {
    do_some_work();
    let c = call(id(), "nested_call", ());
❶   let i = performance_counter(0);
    c.await;
    do_some_work();
    let c = call(id(), "nested_call", ());
❷   let j = performance_counter(0);
    c.await;
    do_some_work();
❸   let k = performance_counter(0);
    i + j + k
}
Even this simple example becomes spaghetti, as every single await point must be changed. Imagine a bit more complicated code, with many nested functions and library calls… It’s a challenge to properly instrument production asynchronous code!
On the other hand, the new call context counter still must be explicitly collected at the end of the function:
#[query(composite = true)]
async fn example() -> u64 {
    do_some_work();
    call(id(), "nested_call", ()).await;
    do_some_work();
    call(id(), "nested_call", ()).await;
    do_some_work();
❶   performance_counter(1) // i + j + k
}
But in this case there is no need to instrument every single await point in the nested functions or libraries. There is just one place, right before the counter is returned. It’s a huge step forward to fully automate the code instrumentation and profiling in the future.
Using performance counters
To quickly run the performance counters example (assuming the Internet Computer SDK is already installed):
$ git clone git@github.com:dfinity/examples.git
$ cd examples/rust/performance_counters
$ cargo update
$ dfx start --clean --background
$ dfx deploy
$ dfx canister call performance_counters example
(7_012_128 : nat64, 21_568_690 : nat64)
The example function returns two values: the old counter (type 0) and the new one (type 1). As the new call context counter includes all three message executions, it reports three times more WebAssembly instructions: 21 million vs just 7 million.
Please check the performance counters example on GitHub for detailed instructions.
The new async-friendly performance counter is available everywhere:
Rust:       ic_cdk::api::performance_counter(1);
Motoko:     import IC "mo:base/ExperimentalInternetComputer";
            IC.performanceCounter(1);
TypeScript: import ic from 'azle';
            ic.performanceCounter(1);
Python:     from kybra import ic
            ic.performance_counter(1)
Resources
Backend developers guide: Optimizing Rust canisters.
Motoko developers guide: Optimizing canisters.